.svg)


Talk Data to Me

Data is something I have always been fond of ever since my first role as a Business Analyst. I find it amazing how powerful data can be, when used correctly, and seem to find some strange enjoyment in crunching the numbers when the route to an answer is not always clear cut.
Data is becoming ever-more abundant as technology advances meaning we will have more opportunities to utilise it to our advantage – but what is data and how do we use it in a way that maximises our chances of success? In this article, I will be talking about what data is, how we process it to gather actual insights and the things to be aware of when working with a dataset.
Data & Insights
So, what is data? Data is defined as the value of a variable, or in simple terms, a collection of facts and figures.
It is interesting to note that data has no relevance on its own and context must be applied for data to become meaningful. There is a concept known as the Data, Information, Knowledge & Wisdom pyramid, which suggests that data must go through a journey before it provides actionable insights. Data is the starting point, and within this framework it is defined as raw, unstructured facts and figures without context or meaning, for example: 1, 1, 0, 2 & 3.
The next stage involves turning this meaningless data into information by applying context. Using a manufacturing example, 1, 1, 0, 2 & 3 could highlight the number of shopfloor accidents each day within a week. With this understanding of context, we can start analysing the information which ultimately transforms it into actionable knowledge.
From the analysis, we gain the insight that the most shopfloor accidents happened on day 4 and day 5 within the recorded data. We then apply human values, judgement and beliefs to determine actions – this is where the knowledge becomes wisdom. In this example, the shift manager could analyse the data and notice that a certain product type was produced on day 4 and 5. After reviewing the standard operating procedures for these product types, the manager notices that the manual handling specification did not meet the required standards and introduced a process change to reduce the risk of future accidents.
Whilst the example above was fictitious, it clearly indicates how a seemingly random set of numbers can lead to critical improvement actions when the raw data is processed and context applied. Let’s recap:
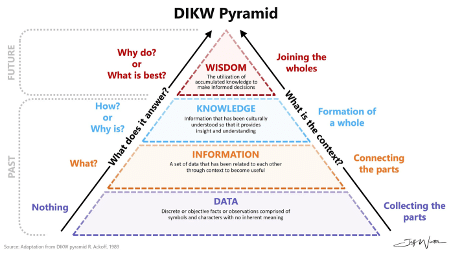
Visual graphic from: https://www.jeffwinterinsights.com/insights/dikw-pyramid (Jeff Winter, 2024)
Transforming and Visualising Data
Transforming data into knowledge and wisdom sits at the core of data analysis, but this process isn’t always straight forward, especially with large, complex datasets. There are various methods for conducting sophisticated data analysis, but regardless of the analysis method, the output usually comes in the form of a data visualisation.
Data visualisation refers to the graphical representation of data through a visual medium such as charts, graphs and maps, which provide an accessible way to identify trends, patterns and outliers in a dataset. Producing a strong visual output is often critical when processing data in the pursuit of information, knowledge and wisdom, but doing this effectively is not always easy.
There are many common methods of data visualisation, many of which we see in our day-to-day lives – bar charts at work, nutrition pie charts on our fitness apps or even thermostats in our homes measuring energy usage. There are many types of visualisations, some of which are only applicable in certain cases, but my best advice would be to experiment and be conscious of what each visualisation showing you – some things will work and others will not. Force yourself to remain curious as you work with the data and you will often stumble across answers you weren’t even looking for.
During my time in the industry, I have come to learn the value of not looking for a specific outcome during the analysis phase. Sometimes we have a theory or a point we want to prove and look to the data to help us prove that point – it is vital that you let the data tell its own story organically (if your gut feeling is strong then the data will likely match), so it is important to stay open minded and shy away from early conclusions. As I said before, you may stumble across new avenues that you didn’t know existed.
Bias in Data
There is also a major risk when trying to force a specific outcome throughout our analysis – bias. In the world of data, bias refers to a systematic error where the data doesn’t accurately represent reality, often due to skewed collection, historical prejudices, or flawed analysis, ultimately leading to inaccurate insights and unfair outcomes. It can be rather difficult to completely omit bias from a study, so it is important to be aware of the ways in which it can occur. The most common types are:
- Historical Bias – Where biased data from a previous model or system is used.
- Selection Bias – Where all groups do not have an equal chance to be included in the study (e.g. only a selection of people within a department are interviewed, not the whole department).
- Measurement Bias – Inaccurate or inconsistent data collection methods (e.g. faulty measurement tools).
- Confirmation Bias – Interpreting data to fit pre-existing beliefs whilst ignoring contradictory evidence and data (this is the type of bias I spoke about in the previous section).
- Algorithmic Bias – Errors introduced by algorithms (pre-conditioned analysis steps), which often amplify any existing biases within the data.
Bias is important to recognise and remain conscious of during analysis, as there is little point of conducting the analysis if the answers it provides are inaccurate and untrustworthy. There are various methods to avoiding bias which mainly centre around collecting a diverse dataset, being mindful of how bias occurs during analysis and rigorous testing of the model across different datasets to identify where bias may arise. Ultimately, when it comes to data and data analysis, be curious but also be conscious and you will not go far wrong.
Closing Thoughts
During my time as both a Business Analyst and Manufacturing Consultant, I have seen data transform the decision-making process and lead to outcomes that initially seemed impossible. With the right data, correct transformation process and effective review methods, I have seen data reduce costs, identify gaps in processes and result in a better operation all-round. Data can be a daunting thing to work with at times, but I urge you to find comfort in not knowing the answer straight away, working through the data and waiting for something to jump out at you – it really is quite magical when it happens, you just have to give the answer time to present itself amongst all of the noise.
If you are interested to see how your data ecosystem can be enhanced, please get in touch – we would love to help uncover the insights that lie deep within your data.
 Back to news articles


